Monitoring complex systems is a challenge that grows with scale. As your infrastructure expands, manual configuration of monitoring tools becomes increasingly time-consuming and error-prone. This is where Observability as Code (OaC) comes in.
OaC applies the principles of Infrastructure as Code to your monitoring setup, automating and standardizing how you track your systems' health and performance. But what exactly is OaC, and how can you use it to streamline your monitoring workflow? This article unpacks what OaC is, why it matters, and how to implement it for a streamlined monitoring workflow.
What is Observability as Code?
Observability as Code is a DevOps approach that integrates observability practices directly into your codebase. Instead of manually configuring dashboards, alerts, and monitoring rules through user interfaces, you define these elements in code. This code is then version-controlled, reviewed, and deployed alongside your application code.
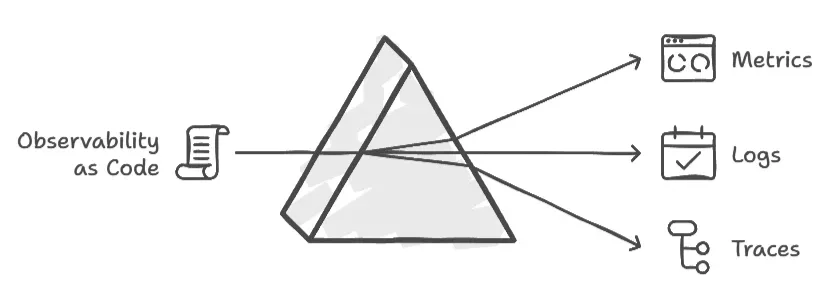
Key Components of OaC
- Metrics: Numerical data points that represent system performance
- Logs: Detailed records of events within your system
- Traces: Information about request flows through distributed systems

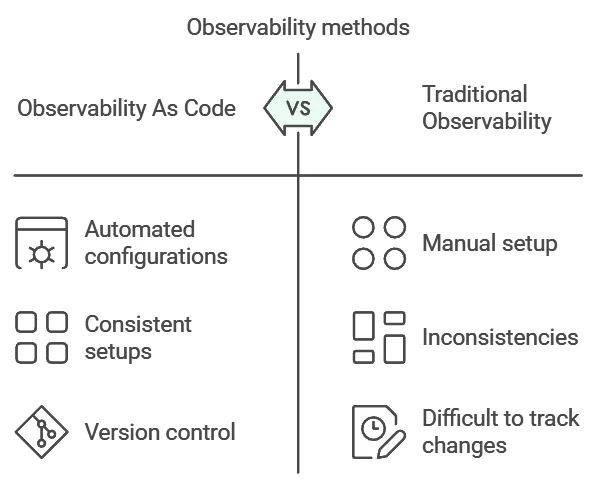
OaC vs Traditional Observability Methods
OaC differs from traditional observability methods in several ways:
- Automation: Configuration changes are applied automatically, reducing human error
- Version Control: Changes to monitoring setups are tracked and can be rolled back if needed
- Consistency: Ensures uniform monitoring across different environments
- Scalability: Easily replicate monitoring setups across multiple services or applications

Evolution from Infrastructure as Code to Observability as Code
Infrastructure as Code (IaC) emerged in response to the challenges of managing complex infrastructure manually. Before IaC, configuring servers, networks, and other infrastructure components was a time-consuming and error-prone process. Teams would often rely on manual scripts, or even worse, perform configuration by hand, leading to inconsistencies and lack of repeatability.
IaC sought to address these issues by enabling the automation of infrastructure setup and management through code. Tools like Terraform, CloudFormation, and Ansible allowed teams to define their infrastructure using high-level code or configuration files.
How Observability as Code (OaC) Builds Upon IaC Principles
Observability as Code builds on principles from Infrastructure as Code (IaC), where teams automate infrastructure provisioning with tools like Terraform. The same logic applies here: if you can automate your infrastructure, why not automate your observability?
OaC applies the same concept of treating configuration as code, but for observability tools and monitoring systems. This involves defining and automating the setup of observability components (like logging, tracing, and metrics systems) as code. Just as IaC ensures infrastructure is reproducible, OaC ensures that observability setups are consistent and easily adjustable.
OaC builds upon IaC by enabling:
- Version-controlled observability configurations.
- Automated provisioning and management of observability tools.
- Seamless integration of monitoring and logging tools into the deployment pipeline.
- Reproducibility and portability of observability setups.
Benefits of Treating Observability Configurations as Code
The shift towards automated configuration of observability tools offers several benefits:
- Reduced setup time: Automate the creation of dashboards, alerts, and monitoring rules
- Improved collaboration: Developers and operations teams can work together on monitoring configurations
- Consistency across environments: Ensure that production, staging, and development have identical monitoring setups
- Easier auditing and compliance: Track changes to monitoring configurations over time
Why is Observability as Code Important?
Implementing OaC can significantly improve your monitoring workflow and overall system reliability. Here's why it's becoming increasingly important:

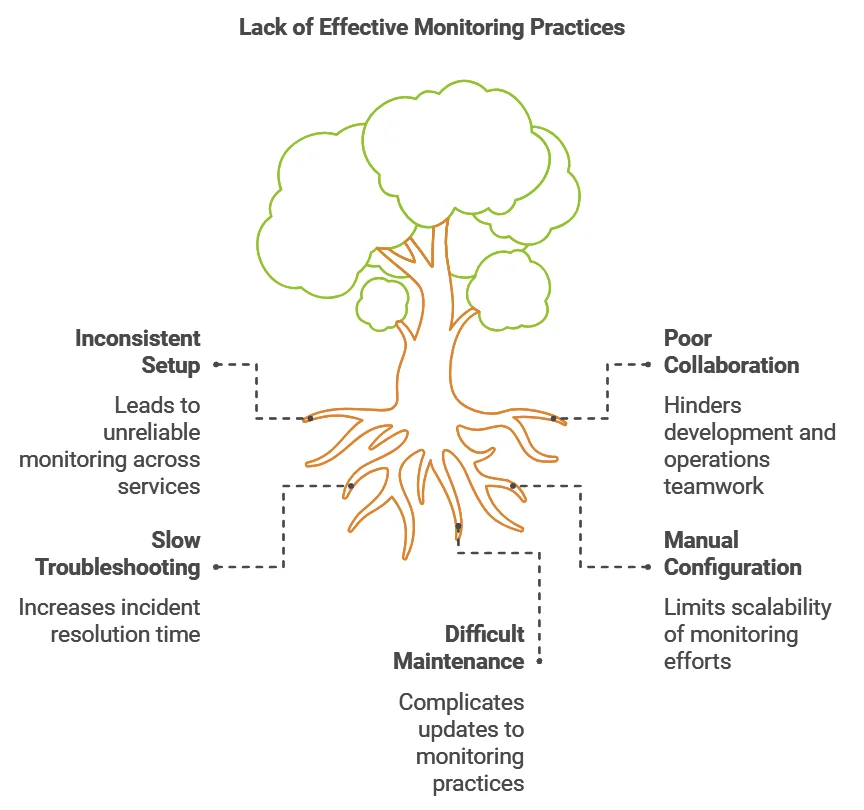
- Improved consistency and repeatability: With OaC, you define your monitoring setup once and can easily replicate it across multiple services or environments. This ensures consistent monitoring practices throughout your organization.
- Enhanced collaboration: By treating observability configurations as code, you enable better collaboration between development and operations teams. Developers can contribute to monitoring setups, while operations teams can review and approve changes.
- Faster troubleshooting: When monitoring configurations are part of your codebase, it's easier to configure dashboards and alerts which can be updated based on code changes. This can significantly reduce your mean time to resolution (MTTR) for incidents.
- Scalability: As your system grows, manually configuring monitoring for each new service becomes unsustainable. OaC allows you to scale your observability practices alongside your infrastructure.
- Maintainability: With OaC, updating monitoring configurations across your entire system is as simple as updating and deploying code. This makes it easier to keep your monitoring practices up-to-date and relevant.
How to Implement Observability as Code
Implementing OaC requires careful planning and the right tools. Here's a step-by-step guide to get you started:
Choose the right tools: Select observability platforms that support OaC principles. Tools like Prometheus, Grafana, and SigNoz offer APIs and configuration-as-code options.
Define your observability needs: Identify the key metrics, logs, and traces you need to monitor across your system.
Create templates: Develop reusable templates for common monitoring configurations. These might include standard dashboard layouts or alert thresholds.
Write your configurations: Use a declarative language like YAML or JSON to define your monitoring setup. Here's a simple example using YAML:
dashboard:
  name: "API Performance"
  panels:
    - title: "Request Rate"
      metric: "http_requests_total"
      type: "graph"
    - title: "Response Time"
      metric: "http_request_duration_seconds"
      type: "heatmap"
alerts:
  - name: "High Error Rate"
    condition: "rate(http_errors_total[5m]) > 0.05"
    severity: "critical"
Version control: Store your observability configurations in a version control system like Git.
Integrate with CI/CD: Automate the deployment of your observability configurations as part of your CI/CD pipeline.
Review and iterate: Regularly review your OaC setup and make improvements based on your evolving needs.
Overcoming Common Challenges in OaC Implementation
While OaC offers many benefits, it's not without its challenges. Here are some common hurdles and how to address them:
- Learning curve: OaC requires a shift in mindset and new skills. Invest in training for your team and start with small, manageable projects.
- Complexity management: As your OaC setup grows, it can become complex. Use modular designs and clear documentation to keep things manageable.
- Balancing flexibility and standardization: While standardization is a key benefit of OaC, you also need flexibility for unique monitoring needs. Create a balance by defining core standards while allowing for customization where necessary.
- Security and compliance: Ensure that your OaC practices adhere to security best practices and compliance requirements. Implement access controls and audit trails for your observability configurations.
Streamlining Your Monitoring Workflow with SigNoz
SigNoz is a comprehensive observability platform that supports Observability as Code principles. It offers both cloud and open-source options, making it suitable for a wide range of use cases. It integrates seamlessly with OpenTelemetry, allowing you to monitor metrics, traces, and logs from a single interface.
Key features of SigNoz that support OaC include:
- YAML-based Configurations: Automate the creation and management of dashboards, alerts, and other monitoring configurations.
- Version-controlled configurations: Store your SigNoz setup in your code repository.
- Integration with CI/CD tools: Easily incorporate SigNoz configurations into your existing deployment pipelines.
- Open Standards: Built on OpenTelemetry, making it future-proof and vendor-neutral.
- Scalable: Works for both small teams and enterprise-scale applications.
SigNoz cloud is the easiest way to run SigNoz. Sign up for a free account and get 30 days of unlimited access to all features.
You can also install and self-host SigNoz yourself since it is open-source. With 19,000+ GitHub stars, open-source SigNoz is loved by developers. Find the instructions to self-host SigNoz.
Comparing SigNoz Cloud and Open-Source Options for Different Use Cases
SigNoz offers two deployment models—SigNoz Cloud and SigNoz Open Source—to cater to diverse needs. Here's how they stack up:
| Aspect | SigNoz Cloud | SigNoz Open Source |
|---|---|---|
| Hosting | Fully managed by SigNoz | Self-hosted on your infrastructure |
| Setup | Quick and easy with minimal effort | Requires technical expertise for setup |
| Maintenance | Automated updates and monitoring | Requires manual maintenance and upgrades |
| Privacy & Compliance | Data hosted on SigNoz servers | Data remains within your own environment |
| Cost Model | Pay-as-you-go pricing | Free to use; infrastructure costs apply |
| Customizability | Limited to provided features | Fully customizable for unique requirements |
| Use Case | Ideal for startups and SMBs | Suitable for enterprises and privacy-focused teams |
Choosing the Right Option
- Opt for SigNoz Cloud if you prefer a managed solution that minimizes operational overhead and gets you started quickly.
- Choose SigNoz Open Source if you value full control over your observability stack, need on-premises data management, or have the resources to maintain the system.
Real-World Examples of Observability as Code
Let's look at some real-world examples of how organizations can implement OaC:
- Scaling Microservices in E-commerce
- Scenario: An e-commerce platform running hundreds of microservices wants to monitor inventory, order processing, and customer activity during high-traffic events like Black Friday.
- OaC in Action: Developers define monitoring rules, alerts, and dashboards in configuration files stored in version control. These configurations are automatically deployed alongside application updates.
- Improvements:
- Scalability: Rapidly replicate observability setups for new services.
- Consistency: Ensure each service has identical monitoring standards.
- Speed: Automate incident detection, enabling faster response times.
- Incident Management for Fintech Applications
- Scenario: A fintech company needs to track API response times and detect unusual transaction patterns in real-time.
- OaC in Action: The team uses OaC to configure distributed tracing and alert thresholds across all services handling payments and user authentication.
- Improvements:
- Faster Troubleshooting: Centralized and automated logging helps identify bottlenecks.
- Improved Collaboration: Developers and SREs can jointly iterate on monitoring configurations in Git.
- Managing Cloud-Native Workloads
- Scenario: A company managing Kubernetes workloads across multiple clusters wants consistent observability for applications, pods, and nodes.
- OaC in Action: The team uses tools like Helm charts or Terraform to deploy Prometheus for metrics and Jaeger for tracing, with configurations stored in Git repositories.
- Improvements:
- Consistency: Uniform observability across clusters.
- Version Control: Audit changes to monitoring setups easily.
- Disaster Recovery: Recreate observability setups quickly in case of failures.
Future Trends in Observability as Code
As technology evolves, so too will OaC practices. Here are some trends to watch:
- AI-driven observability: Machine learning algorithms will increasingly be used to analyze observability data and suggest optimal monitoring configurations.
- GitOps for observability: The GitOps approach, which uses Git as the single source of truth for declarative infrastructure, will be increasingly applied to observability practices.
- Observability mesh: Similar to service mesh for microservices, we may see the emergence of standardized, platform-agnostic ways to define and implement observability across diverse environments.
- Shift-left observability: OaC will enable teams to consider and implement observability earlier in the development lifecycle, improving overall system reliability.
Key Takeaways
- Observability as Code brings automation, consistency, and version control to your monitoring practices.
- OaC improves collaboration between development and operations teams, enhancing overall system reliability.
- Implementing OaC requires careful tool selection and integration with existing workflows.
- Platforms like SigNoz offer robust support for OaC principles, helping streamline your monitoring workflow.
- The future of OaC is closely tied to advancements in AI, GitOps, and DevOps practices.
FAQs
What are the main benefits of Observability as Code?
The main benefits include improved consistency in monitoring setups, enhanced collaboration between teams, faster troubleshooting, and better scalability of observability practices.
How does Observability as Code differ from traditional monitoring approaches?
OaC automates and standardizes monitoring configurations, treating them as code rather than manual setups. This allows for version control, easier replication, and integration with CI/CD pipelines.
What tools are commonly used for implementing Observability as Code?
Common tools include Prometheus, Grafana, Terraform, and platforms like SigNoz that offer API-driven configuration options.
Can Observability as Code be implemented in legacy systems?
Yes, OaC can be implemented in legacy systems, though it may require more effort. Start by identifying key metrics and gradually move towards automated, code-based configurations.

